We’ve all been there. There is a new architect and he wants to get insight in the project you are working on. Or an audit takes place and the auditor wants to know which services you are using and which other services are using yours.
What happens?
The Product Owner comes to you and asks you to deliver the architecture scheme. Your first thought is: “Darn it, I don’t want to do that.” Your second thought is: “I do have seen this architecture scheme like a year ago. Where is it again?” So you begin to search on Confluence, scroll through your inbox and check if it is somewhere saved on your computer.
If you are lucky and you manage to find the architecture scheme, you notice that the scheme is outdated and not representing the current situation. There are new services, the connection between services is changed, log4j has added a new security layer, etc. To update this scheme is not going to be easy, because of all the changes you know about, and then there are the changes you might not know about.
If only there was a way to keep track of changes. A way to see the history of the architecture?
Wait… we already have that! Why don’t we treat architecture as we treat code? Instead of capturing the current state of the architecture in a PowerPoint or other diagram tool, you can create a small application of it. You can host this application, so that it is accessible to everyone. If the code changes within the architecture, you can see what has changed and who has done it. Easy.
Introducing Graphviz and vis.js.
Graphviz
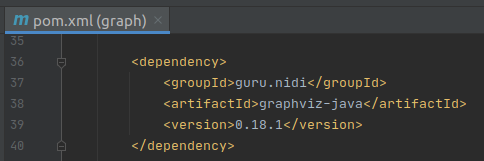
Graphviz is an open source graph visualization software. It uses nodes, edges and dependencies to construct a graph in DOT language. There is also a Java library which I will use in the examples.
Here’s how Graphiz works.
Nodes
First we have to define the nodes for the graph.
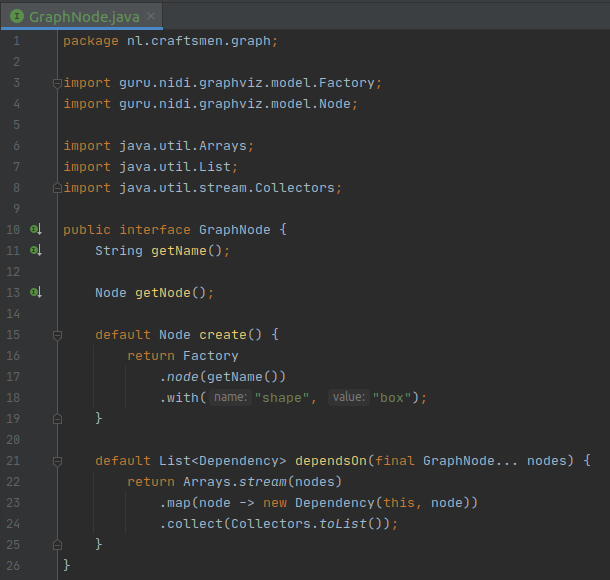
Let’s implement the nodes.

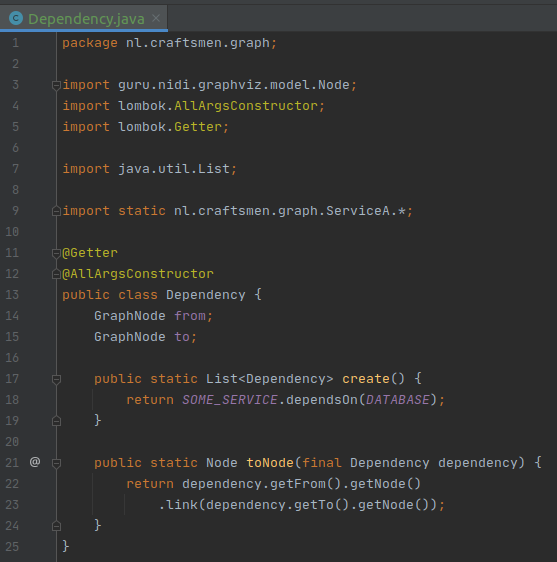
And determine the dependencies between the nodes:
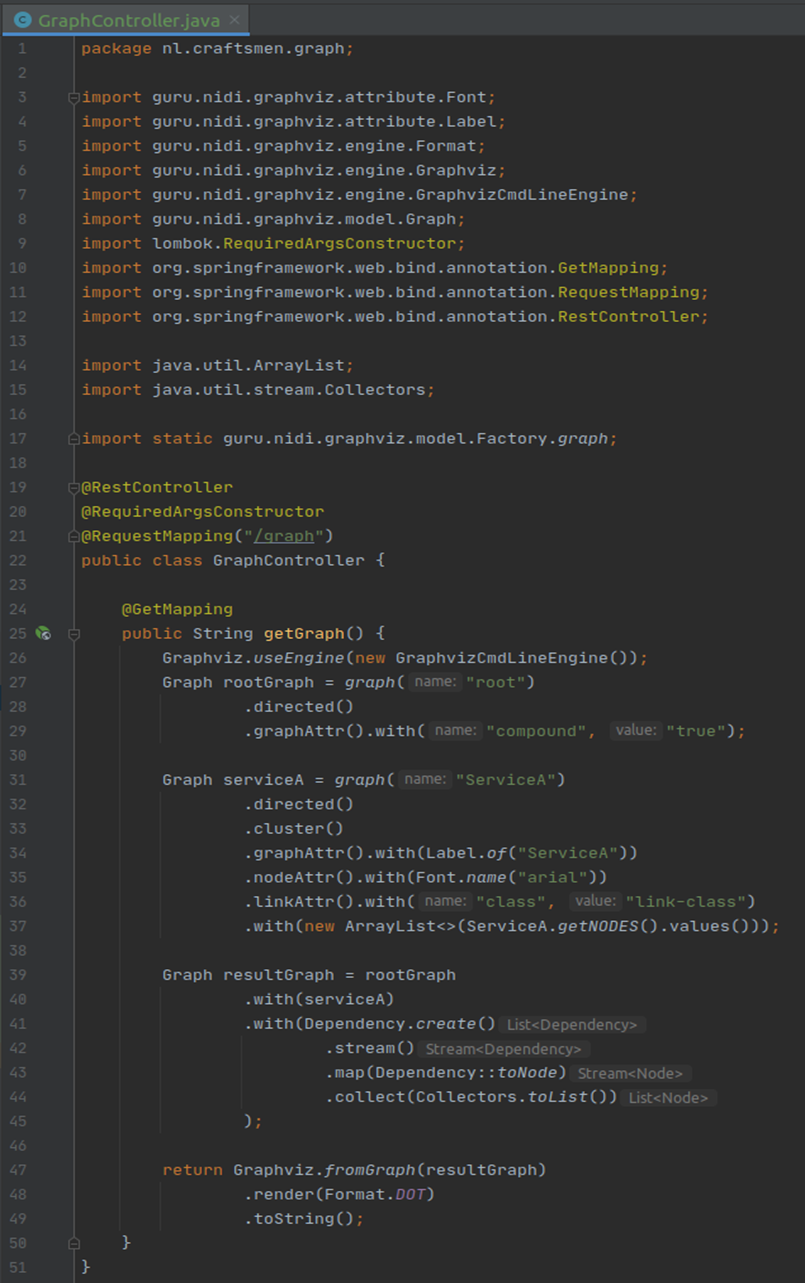
Last, we need a Controller which returns the created (DOT) graph as response of a /graph endpoint.
Now we constructed a graph containing nodes and dependencies, we are ready to present the graph by using vis.js.
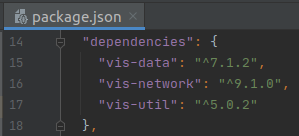
Vis.js
Vis.js is a dynamic, browser based visualization library. It can be used to visualize a network, timeline or 2D/3D graphs. We will use the network representation for the architecture scheme. Vis.js uses HTML canvas for rendering.
Create an HTML-element where the graph will be presented, like:
![]()
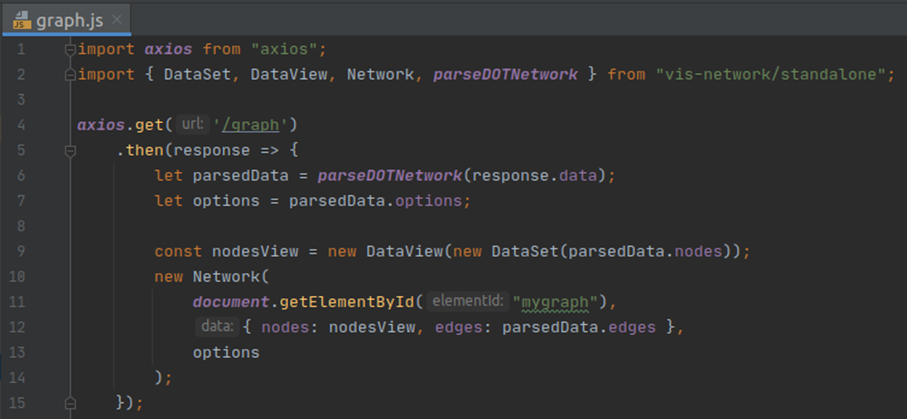
Then call the endpoint of the created DOT graph and put it in the above created HTML-element.
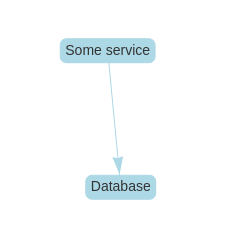
When starting the application we see a graph like this.
By adding more nodes, node types and dependencies between them you can get a good overview of the architecture. Vis.js makes sure that no nodes overlap. It always constructs a state of the graph in which every node is visible.
By playing around and tweaking the options of the vis.js graph (see link below) you can determine the distance between the nodes, enabling navigation and zooming in/out (very handy for large graphs).
In Graphviz you can also do some configuration like the shape of a node, color, provide additional information etc.
Conclusion
By hosting the web application, everyone has access to the architecture scheme of the project. The history is captured by the version control, so you can see who has changed what part of the architecture. And for years to come, the evolution of the project is no longer a question mark.
Bye bye distracting Product Owner questions! Back to our favorite job: coding!
Links
– Graphviz: https://github.com/nidi3/graphviz-java
– Vis.js: https://visjs.github.io/vis-network/docs/network/