Introduction
For a Java Spring Boot project I was working on a while ago I had to build in some application monitoring for measuring the number of requests on REST endpoints and also for monitoring JVM and OS metrics. These metrics needed to be send to Graphite. Graphite is a great open source tool for handling visualizations and metrics and it offers a powerful querying API.
Graphite itself does not collect any metrics though. It requires metrics to be sent to it in a Graphite format. There are many metric collection tools available for a various number of languages. For Java Dropwizard Metrics is a popular and powerful library that provides us with ways to measure the behavior of critical components in our production environment and it offers a good visibility on the metrics of these components. It also offers a Graphite reporter that can send all this data to our Graphite deployment. It is a solid foundation for using Graphite with Java.
This blog however is not about installing Graphite nor is it about how to create dashboards and nice graphs in Graphite. If you are interested in how Graphite works and which components it exists of, you can read this article. InfoQ also has a nice article about installing graphite and about creating graphs in graphite.
So what is this blog about then? What I will describe is how I integrated Dropwizard Metrics within my Spring Boot application. A full working demo application (a REST API for maintaining customers) and a docker image with Graphite are available on Github for those that are interested to try it out themselves. Feel free to clone these projects to play around with.
Setup Maven dependencies
First of all we need to include some maven dependencies in our project. Instead of including the metrics-core dependency (as the Dropwizard Metrics getting started mentions) we can include the following dependency:
  com.ryantenney.metrics
  metrics-spring
  3.1.2
which will transitively provide us with the metrics-core dependency and it will also provide us with two other useful dependencies: metrics-healthchecks and metrics-annotations. Especially the latter is interesting. It will allow us to simply add annotations like @Metered, @Timed, @Counted and @ExceptionMetered to our methods.
Furthermore we need to include the following dependency:
  io.dropwizard.metrics
  metrics-graphite
  3.1.2
which provides us with a GraphiteReporter that we can use to send our metrics to a Graphite server.
The last metrics related dependency we need is:
  io.dropwizard.metrics
  metrics-jvm
  3.1.2
Environment specific configuration
For my application I want to be able to monitor multiple environments and push the data to Graphite under a separate location. We can do this by creating a prefix. For monitoring the application in the test environment, we could add the following configuration class:
package com.craftsmen.graphite.monitoring.example.infrastructure;

import javax.annotation.PostConstruct;
import org.springframework.context.annotation.Configuration;
import org.springframework.context.annotation.Profile;

@Configuration
@EnableMetrics
@Profile({ "test" })
public class MonitoringConfigurationTestEnvironment
  extends AbstractMonitoringConfiguration {

  private static final String GRAPHITE_PREFIX =
    "collectd/graphite-monitoring-example/test";

    @Override
    public void configureReporters() {
      configureReporters(GRAPHITE_PREFIX);
    }

    @PostConstruct()
    public void init() {
      configureReporters();
    }
}
and we could add another similar configuration class for monitoring the application in a production environment like so:
package com.craftsmen.graphite.monitoring.example.infrastructure;

import javax.annotation.PostConstruct;
import org.springframework.context.annotation.Configuration;
import org.springframework.context.annotation.Profile;

@Configuration
@EnableMetrics
@Profile({ "prod" })
public class MonitoringConfigurationProductionEnvironment
  extends AbstractMonitoringConfiguration {

    private static final String GRAPHITE_PREFIX =
      "collectd/graphite-monitoring-example/production";

    @Override
    public void configureReporters() {
      configureReporters(GRAPHITE_PREFIX);
    }

    @PostConstruct()
    public void init() {
      configureReporters();
    }
}
In these environment specific configuration classes we need to implement the configureReporters method (lines 16-19). Here we call the configureReporters(String graphitePrefix) method in the AbstractMonitoringConfiguration class so that, based on the active profile, metrics data is pushed to the correct prefix (i.e. location) in Graphite.
Registering our metrics & configuring our reporters
The starting point for Metrics is the MetricRegistry class, which contains a collection of all the metrics for our application. The environment specific configuration classes described above extend AbstractMonitoringConfiguration which contains an instance of this MetricRegistry (lines 30-31):
package com.craftsmen.graphite.monitoring.example.infrastructure;

import java.net.InetSocketAddress;
import java.util.concurrent.TimeUnit;
import javax.inject.Inject;
import org.springframework.beans.factory.annotation.Value;
import com.codahale.metrics.JmxReporter;
import com.codahale.metrics.MetricFilter;
import com.codahale.metrics.MetricRegistry;
import com.codahale.metrics.graphite.Graphite;
import com.codahale.metrics.graphite.GraphiteReporter;
import com.codahale.metrics.graphite.GraphiteReporter.Builder;
import com.codahale.metrics.jvm.GarbageCollectorMetricSet;
import com.codahale.metrics.jvm.MemoryUsageGaugeSet;
import com.codahale.metrics.jvm.ThreadStatesGaugeSet;
import com.ryantenney.metrics.spring.config.annotation.MetricsConfigurerAdapter;

public abstract class AbstractMonitoringConfiguration
  extends MetricsConfigurerAdapter {

  @Value("${graphite.host}")
  private String graphiteHost;

  @Value("${graphite.port}")
  private int graphitePort;

  @Value("${graphite.amount.of.time.between.polls}")
  private long graphiteAmountOfTimeBetweenPolls;

  @Inject
  private MetricRegistry registry;

  private String graphitePrefix;

  abstract protected void configureReporters();

  protected void configureReporters(String graphitePrefix) {
    this.graphitePrefix = graphitePrefix;
    configureReporters(registry);
  }

  @Override
  public void configureReporters(MetricRegistry metricRegistry) {
    registerReporter(JmxReporter.forRegistry(metricRegistry)
      .build()).start();
    GraphiteReporter graphiteReporter =
      getGraphiteReporterBuilder(metricRegistry)
      .build(getGraphite());
    registerReporter(graphiteReporter);
    graphiteReporter.start(graphiteAmountOfTimeBetweenPolls,
      TimeUnit.MILLISECONDS);
  }

  private Builder getGraphiteReporterBuilder(MetricRegistry
    metricRegistry) {
    metricRegistry.register("gc", new GarbageCollectorMetricSet());
    metricRegistry.register("memory", new MemoryUsageGaugeSet());
    metricRegistry.register("threads", new ThreadStatesGaugeSet());
    metricRegistry.register("os", new OperatingSystemGaugeSet());
    return GraphiteReporter.forRegistry(metricRegistry)
      .convertRatesTo(TimeUnit.SECONDS)
      .convertDurationsTo(TimeUnit.MILLISECONDS)
      .filter(MetricFilter.ALL)
      .prefixedWith(graphitePrefix);
  }

  private Graphite getGraphite() {
    return new Graphite(new InetSocketAddress(graphiteHost,
      graphitePort));
  }
}
So what basically happens is that when the environment specific configuration calls the configureReporters method (lines 37-40) we call the configureReporters(MetricRegistry metricRegistry) method which we implemented in (lines 42-52). Here we register different reporters for our metrics like JmxReporter (which is out of scope here) and GraphiteReporter. We register them through the registerReporter method located in the MetricsConfigurerAdapter class. We use this method since it allows the MetricsConfigurerAdapter to shut down the reporter when the Spring context is closed.
To register a GraphiteReporter we first need to create a GraphiteReporter Builder (lines 54-65). First we add the metrics that we are interested in to the metricRegistry by registering them (lines 56-59). There are different kinds of metrics that we can add like Meters, Gauges, Counters, Histograms and Timers which are explained in more detail on the Dropwizard Metrics Getting Started page. Then we create the GraphiteReporter Builder by calling the static forRegistry method, passing in our metricRegistry, which contains the metrics we just added, and we set some conversion rates/durations and filters (lines 60-64). Important to note here is that we also set the graphitePrefix.
Secondly we get a GraphiteReporter by calling the build method on the GraphiteReporter Builder that we have just created. This method takes as input a Graphite client instance which is constructed in lines 67-70, using the graphiteHost and graphitePort instance variables.
Once we have the GraphiteReporter we can register it (line 49) and then start it (lines 50-51).
An interesting thing to point out is the OperatingSystemGaugeSet that is added in line 59. This one is not part of the Dropwizard Metrics library. Besides garbage collection metrics I was looking for a way to measure some more OS specific metrics like process CPU time and total/free physical memory (size). In my search on how to do this I came across an interesting post about logging JVM and OS metrics in a spring application. The OperatingSystemGaugeSet comes from this blogpost and I have added this to the demo application.
In order for the metrics that we registered to be pushed to Graphite, we need to ensure that we add the @EnableMetrics annotation at the top of our environment specific classes (MonitoringConfigurationTestEnvironment and MonitoringConfigurationProductionEnvironment) mentioned earlier. Note that in some cases the @EnableMetrics does not work correctly if it implements any interfaces. In this case Spring AOP attempts to use a Java proxy, instead of a CGLIB Proxy, which would cause problems. The solution would be to eliminate the interface, or to set the attribute proxyTargetClass=true in the @EnableMetrics annotation as described here. Another issue using the @EnableMetrics can occur when using it in a Spring Boot auto configuration class. A solution how to solve that is described here.
Start measuring
Now that everything has been setup, our metrics have been registered and our reporters have been configured, we can start measuring our methods. In my demo application I have created the following REST controller:
package com.craftsmen.graphite.monitoring.example.controller.customer;

import static org.springframework.hateoas.mvc.ControllerLinkBuilder.linkTo;
import java.util.List;
import java.util.NoSuchElementException;
import javax.inject.Inject;
import javax.servlet.http.HttpServletRequest;
import org.springframework.http.HttpStatus;
import org.springframework.http.ResponseEntity;
import org.springframework.web.bind.annotation.PathVariable;
import org.springframework.web.bind.annotation.RequestBody;
import org.springframework.web.bind.annotation.RequestMapping;
import org.springframework.web.bind.annotation.RequestMethod;
import org.springframework.web.bind.annotation.ResponseBody;
import org.springframework.web.bind.annotation.RestController;
import com.codahale.metrics.annotation.ExceptionMetered;
import com.codahale.metrics.annotation.Timed;
import com.craftsmen.graphite.monitoring.example.controller.AbstractHttpController;
import com.craftsmen.graphite.monitoring.example.entities.Customer;
import com.craftsmen.graphite.monitoring.example.service.CustomerService;
import com.ryantenney.metrics.spring.config.annotation.EnableMetrics;

@RestController
public class CustomerController
  extends AbstractHttpController {

  @Inject
  private CustomerService customerService;

  @Inject
  private CustomerToJsonMapper customerToJsonMapper;

  @Inject
  private JsonToCustomerMapper jsonToCustomerMapper;

  @Inject
  private RequestValidator requestValidator;

  /**
   * This method will retrieve the {@link Customer}
   * for the id provided.
   *
   * If the {@link Customer} cannot be found,
   * a {@link NoSuchElementException} will be thrown
   * and a {@link ResponseEntity} with
   * {@link HttpStatus.NO_CONTENT} will be returned.
   * If the {@link Customer} exists, it will be
   * returned in the {@link ResponseEntity}.
   *
   * @param id
   *   the unique identifier for this customer
   * @return {@link ResponseEntity} containing
   *   {@link Customer} retrieved if found,
   *   the HTTP headers and the HTTP status
   *   code
   */
  @RequestMapping(
    value = "/customer/{id}",
    method = RequestMethod.GET,
    produces = JSON_MIME_TYPE)
  @ResponseBody
  @Timed
  @ExceptionMetered
  public ResponseEntity get(@PathVariable Long id,
    HttpServletRequest request) {
    logApiCalls(request);
    String requestUrl = linkTo(CustomerController.class)
      .withSelfRel()
      .getHref();
    Customer customer = customerService.findById(id);
    String response = customerToJsonMapper
      .mapCustomerToJson(customer, requestUrl);
    return new ResponseEntity(response,
      createHeaders(request.getMethod()), HttpStatus.OK);
  }

  // More REST-endpoints here, but left out in this
  // example.
}
Since we included the metrics-spring dependency in our Maven configuration, which transitively provides us with the metrics-annotations dependency, we can just add any of the following annotations to our methods: @CachedGauge, @Counted, @ExceptionMetered, @Gauge, @Metered, @Metric and @Timed
Here I have chosen to add the @Timed and @ExceptionMetered annotations. The general core concepts of Metrics are as follows:
- A
Histogramis a statistical distribution of a stream of data. - A
Metermeasures rates of events. - A
Timeris aHistogramplus aMeter. More specifically aHistogramof the timings of a particular call, and aMeterof the rate at which that call is invoked. - Calls that are
@Timeddo not need to be@Meteredbecause an invocation meter is already included in the timer. - If you would only be interested in the call rate you would use
@Metered. - If you would also be interested in the timing you would use
@Timed(but this also gives you the call rate).
Adding the @ExceptionMetered annotation to the method will create a Meter of the unhandled exceptions thrown out of this method. This will allow us to track the error rates for this specific method. It can be used together with the @Timed or @Metered annotations, or entirely by itself. It will create a name in the registry that will not collide with the @Timed or @Metered metrics.
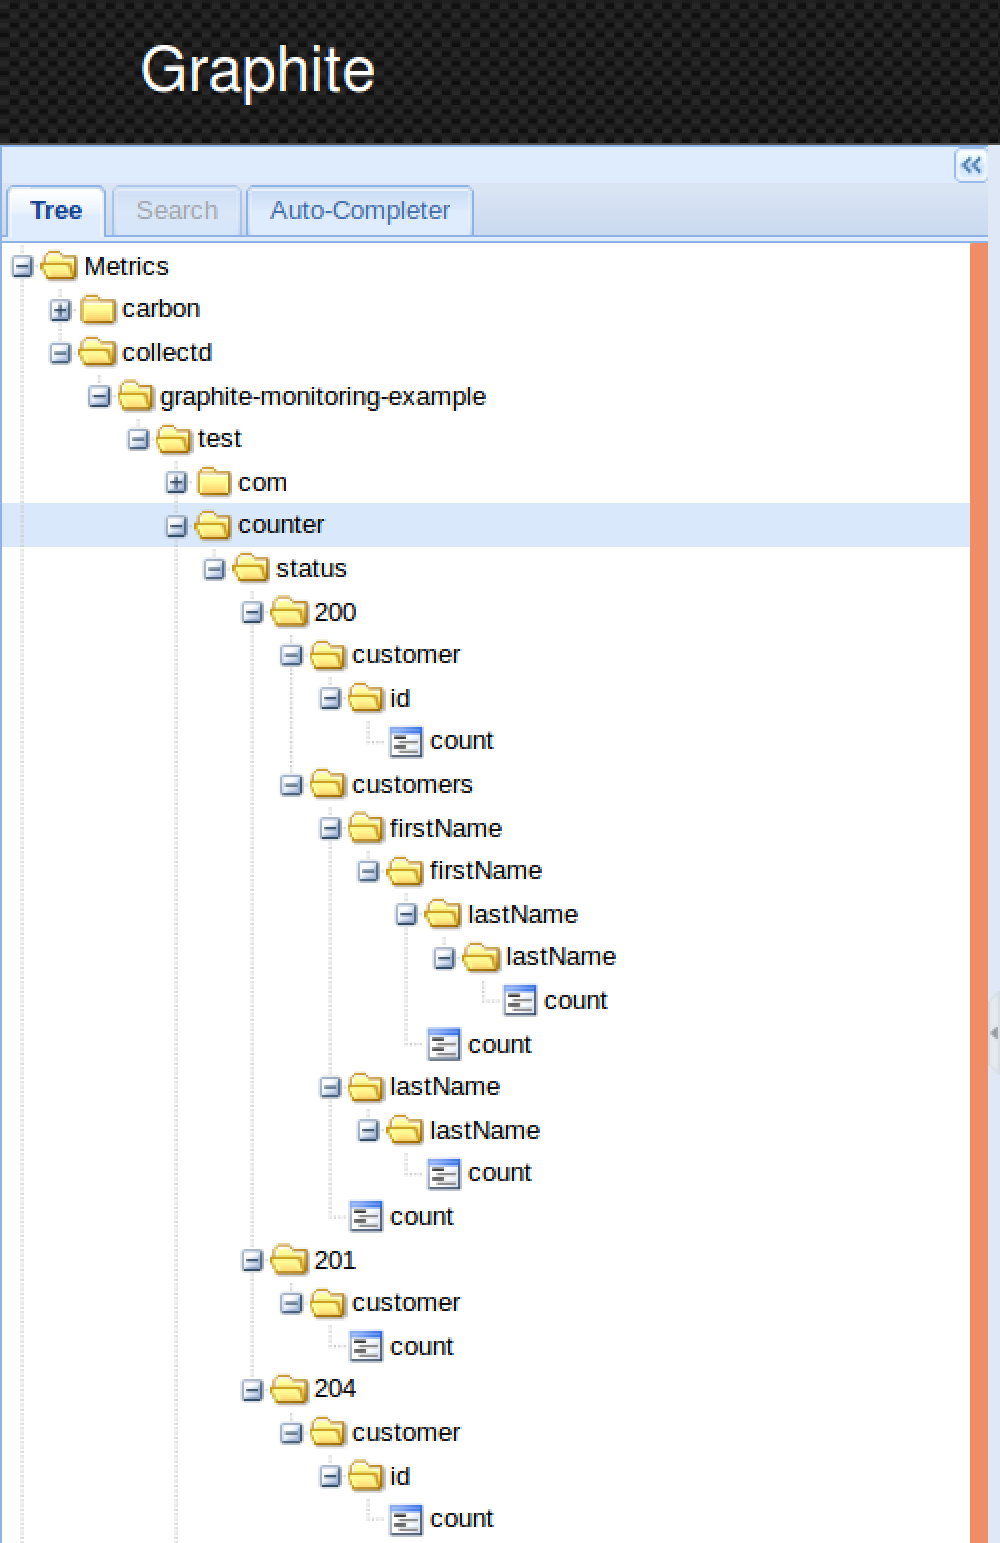
When I run the demo application for the first time it makes some rest calls and posts the data to Graphite:

As you can see here all our data has been pushed to collectd/graphite-monitoring-example/test and is neatly organised per class and method. For the get method we can see that 1000 requests were made and 0 exceptions occurred. The exceptions are organised in a separate folder for each method if we used the @ExceptionMetered annotation.
We can also see that each HTTP status code is monitored for every endpoint we marked with @Timed:
Furthermore we can see that the response times for the different endpoints are being monitored:

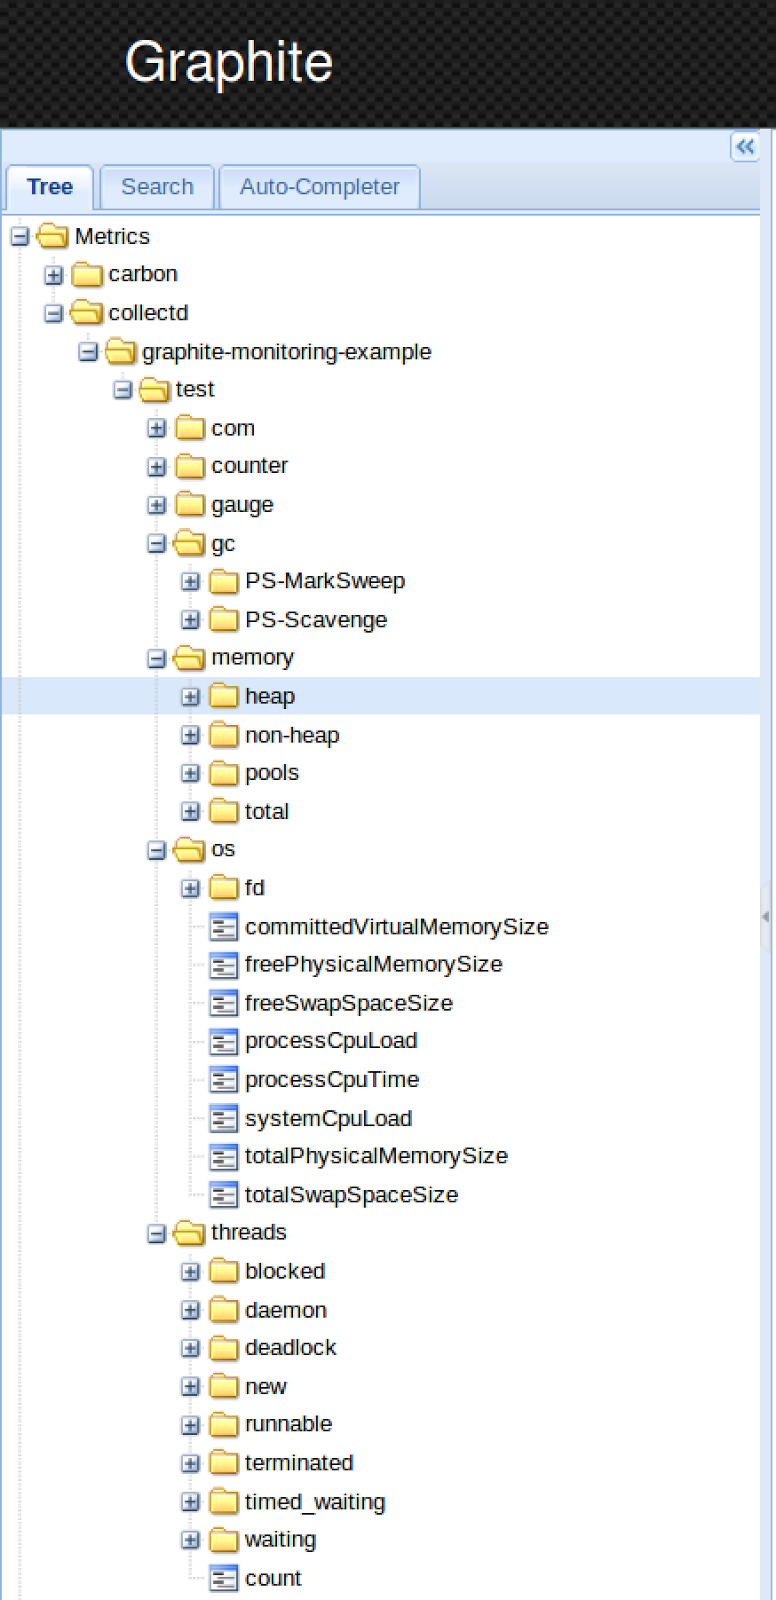
And we also find back our metrics that we registered in the AbstractMonitoringConfiguration class:
Conclusion
In this article I have shown how we can integrate Dropwizard Metrics within a Spring Boot application using Java annotation based configuration. I described which Maven dependencies need to be configured and discussed how we can setup configurations for multiple environments and push the data to Graphite under specific locations. Next I gave an example how metrics and reporters can be registered and finally I have shown an example of a REST controller where we can add Metrics annotations to our methods.
The purpose of gathering all the metrics is to be able to visualize them over a certain timespan. This is what we can use Graphite-web for which allows us to visualize and play with our metrics (as seen in the screenshots above). It provides a fairly solid amount of capabilities in terms of what we can do with our data, but some argue that the visualization component is not exactly beautiful.
But since Graphite has a great extensive API, there are a huge number of alternative dashboards out there which we can interact with. One of the biggest alternative visualization tool for Graphite nowadays is Grafana which is definitely worth looking at.
Resources
- http://metrics.dropwizard.io/
- http://graphite.wikidot.com/
- http://metrics.ryantenney.com/
- https://github.com/ryantenney/metrics-spring/issues/105
- https://github.com/ryantenney/metrics-spring/issues/165
- http://blog.takipi.com/graphite-vs-grafana-build-the-best-monitoring-architecture-for-your-application/
- https://www.linkedin.com/pulse/spring-4-graphite-exporting-metrics-alexandru-godri
- http://blog.progs.be/category/devops
- https://groups.google.com/forum/m/#!topic/dropwizard-user/8kumm9u8Di0
- http://www.programcreek.com/java-api-examples/index.php?api=com.codahale.metrics.annotation.Metered
- http://stackoverflow.com/questions/28499621/codahale-metrics-using-timed-metrics-annotation-in-plain-java
- https://www.infoq.com/articles/graphite-intro


Hi,
Thank you for this article
I read it and dig in the source code of your application but I don’t understand how you get the counters of the HTTP response code
Could you tell me where these counters are registered?
Thank you